Manufacturing plants · Remote · India, UK, US
We find where your plant loses hours.Using the records you already keep.
One week, remote. You get a ranked list of what to fix first, what each fix is worth in hours and units, and the file that shows it. Fixed fee, agreed in writing before we start.
The call is free. Nothing to send, nothing to install.
What we read
- Shift sheets
- Downtime log
- Despatch book
- ERP exports
- Maintenance register
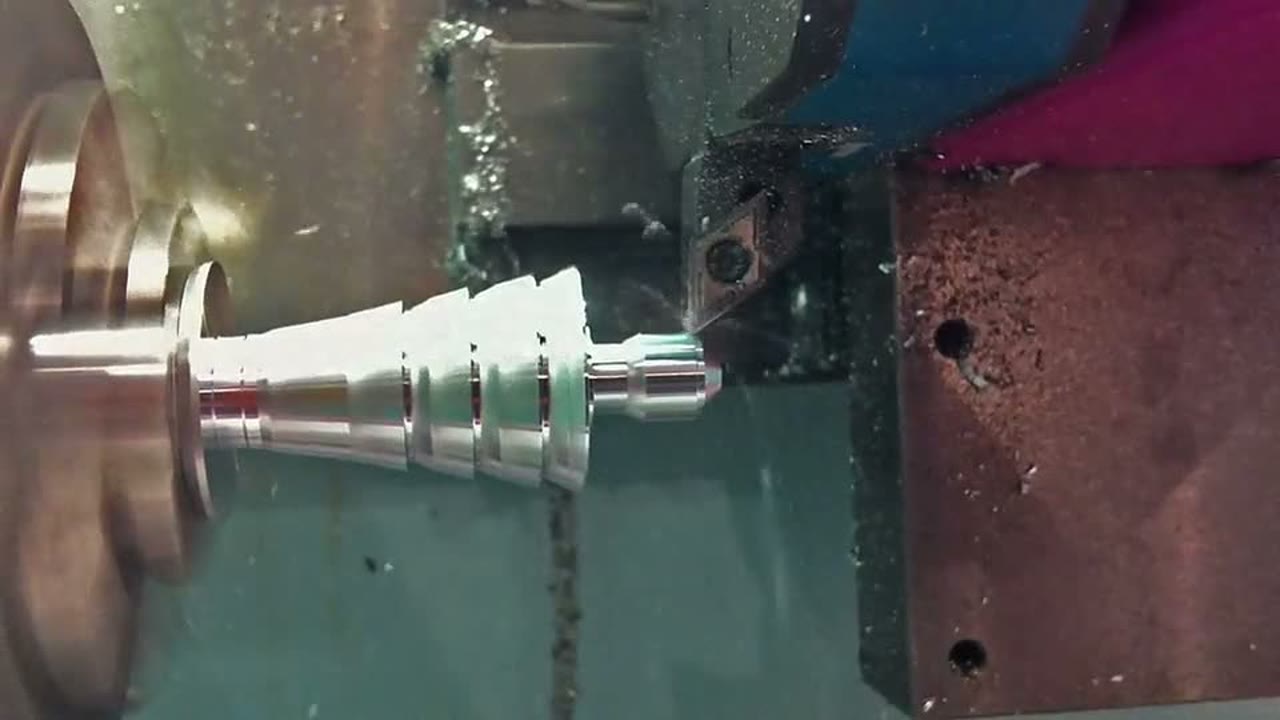
A milling cutter cutting metal under a heavy flood of coolant.
What you get
Three things every plant wants.
Better data, less noise
Cleaner numbers, fewer arguments.
Shift sheets, despatch book and ERP rarely agree. We reconcile them and show exactly where the gaps are. If you want the numbers to stay clean, we build the dashboards and the automatic data extraction, so nobody re-types anything.
Less downtime
Every lost hour, added up.
Most of your lost hours are already written down. Nobody has added them up per machine, per reason, per shift. We do. Once there is enough history, we build the model that flags which machine is likely to fail next, before it stops the line.
More yield
More output from the same plant.
Same machines, same shifts, same people. We find the one operation that caps your output (often not the one with the queue) and put a number on each fix, so you spend first on the fix that pays back first.
Week one is measurement only. Dashboards, automation and prediction come after, and only where the records justify them.
The week
Five days. None of them in your plant.
Illustrative plant. Invented numbers, real method.
Downtime log · sample
+ 210 more rows, all read the same way
28 hrs/mo
Lost on Op 30 across all 214 rows. The machine that sets plant output.
Every stoppage, sorted by machine
214 stoppages from one month of shift sheets. 28 hours of them on Op 30, the machine that sets plant output.
Downtime log · sample
DateSh.OpReasonMin03 MarAOp 30tool change4005 MarBOp 50waiting material6514 MarAOp 30setup8027 MarCOp 30setup120+ 210 more rows, all read the same way
28 hrs/mo
Lost on Op 30 across all 214 rows. The machine that sets plant output.
Three records, one month, three different totals
Shift sheets: 12,840 units. Despatch: 12,310. ERP: 12,955. Planned hours, minus running hours, minus logged stops, leaves 69 hours nobody wrote down.
Reconciliation · one month
Units · shift sheets12,840Units · despatch book12,310Units · ERP postings12,955Op 30 hours · planned 528, running 431, stops 28runningrecorded stopsunexplained69 hrs
Planned, minus running, minus stops. Usually the largest number of the week.
Which machine actually caps output
Everyone pointed at Op 50. It had the queue. Op 30 was loaded to 94% of available hours. That is the constraint.
Load by operation · % of available hours
Op 10
SawOp 20
TurnOp 30
MillOp 40
DrillOp 50
GrindOp 60
WashEveryone pointed at Op 50. It had the queue. Op 30, in orange, set the output.
One view of the shift
Losses, rejects, queue and setups, read off one shift and matched against your own targets.
This shift, at a glance
6.5 hrs
Lost on Op 30 this week (flagged)
2.8%
Rejects this week
41 hrs
Queued in front of Op 30 (flagged)
9
Setups on Op 30 (own target: 6) (flagged)
38%
Of lost hours were tool changes (flagged)
87%
Despatched on the day
One file. Opens in any browser. Yours to keep.
- Monday
Your records arrive.
One month of shift sheets, downtime log, despatch book and ERP exports. Photographed or exported, exactly as they are.
- Tuesday
We reconcile them.
Units and hours across the three records. Every gap listed.
- Wed to Thu
We find what caps your output.
Every machine loaded with your real product mix. The busiest machine is the constraint.
- Friday
You get the read.
What to fix first, what it is worth in hours and units, and the file that shows it.
Where we work
Any plant that keeps records and doesn't quite trust them.
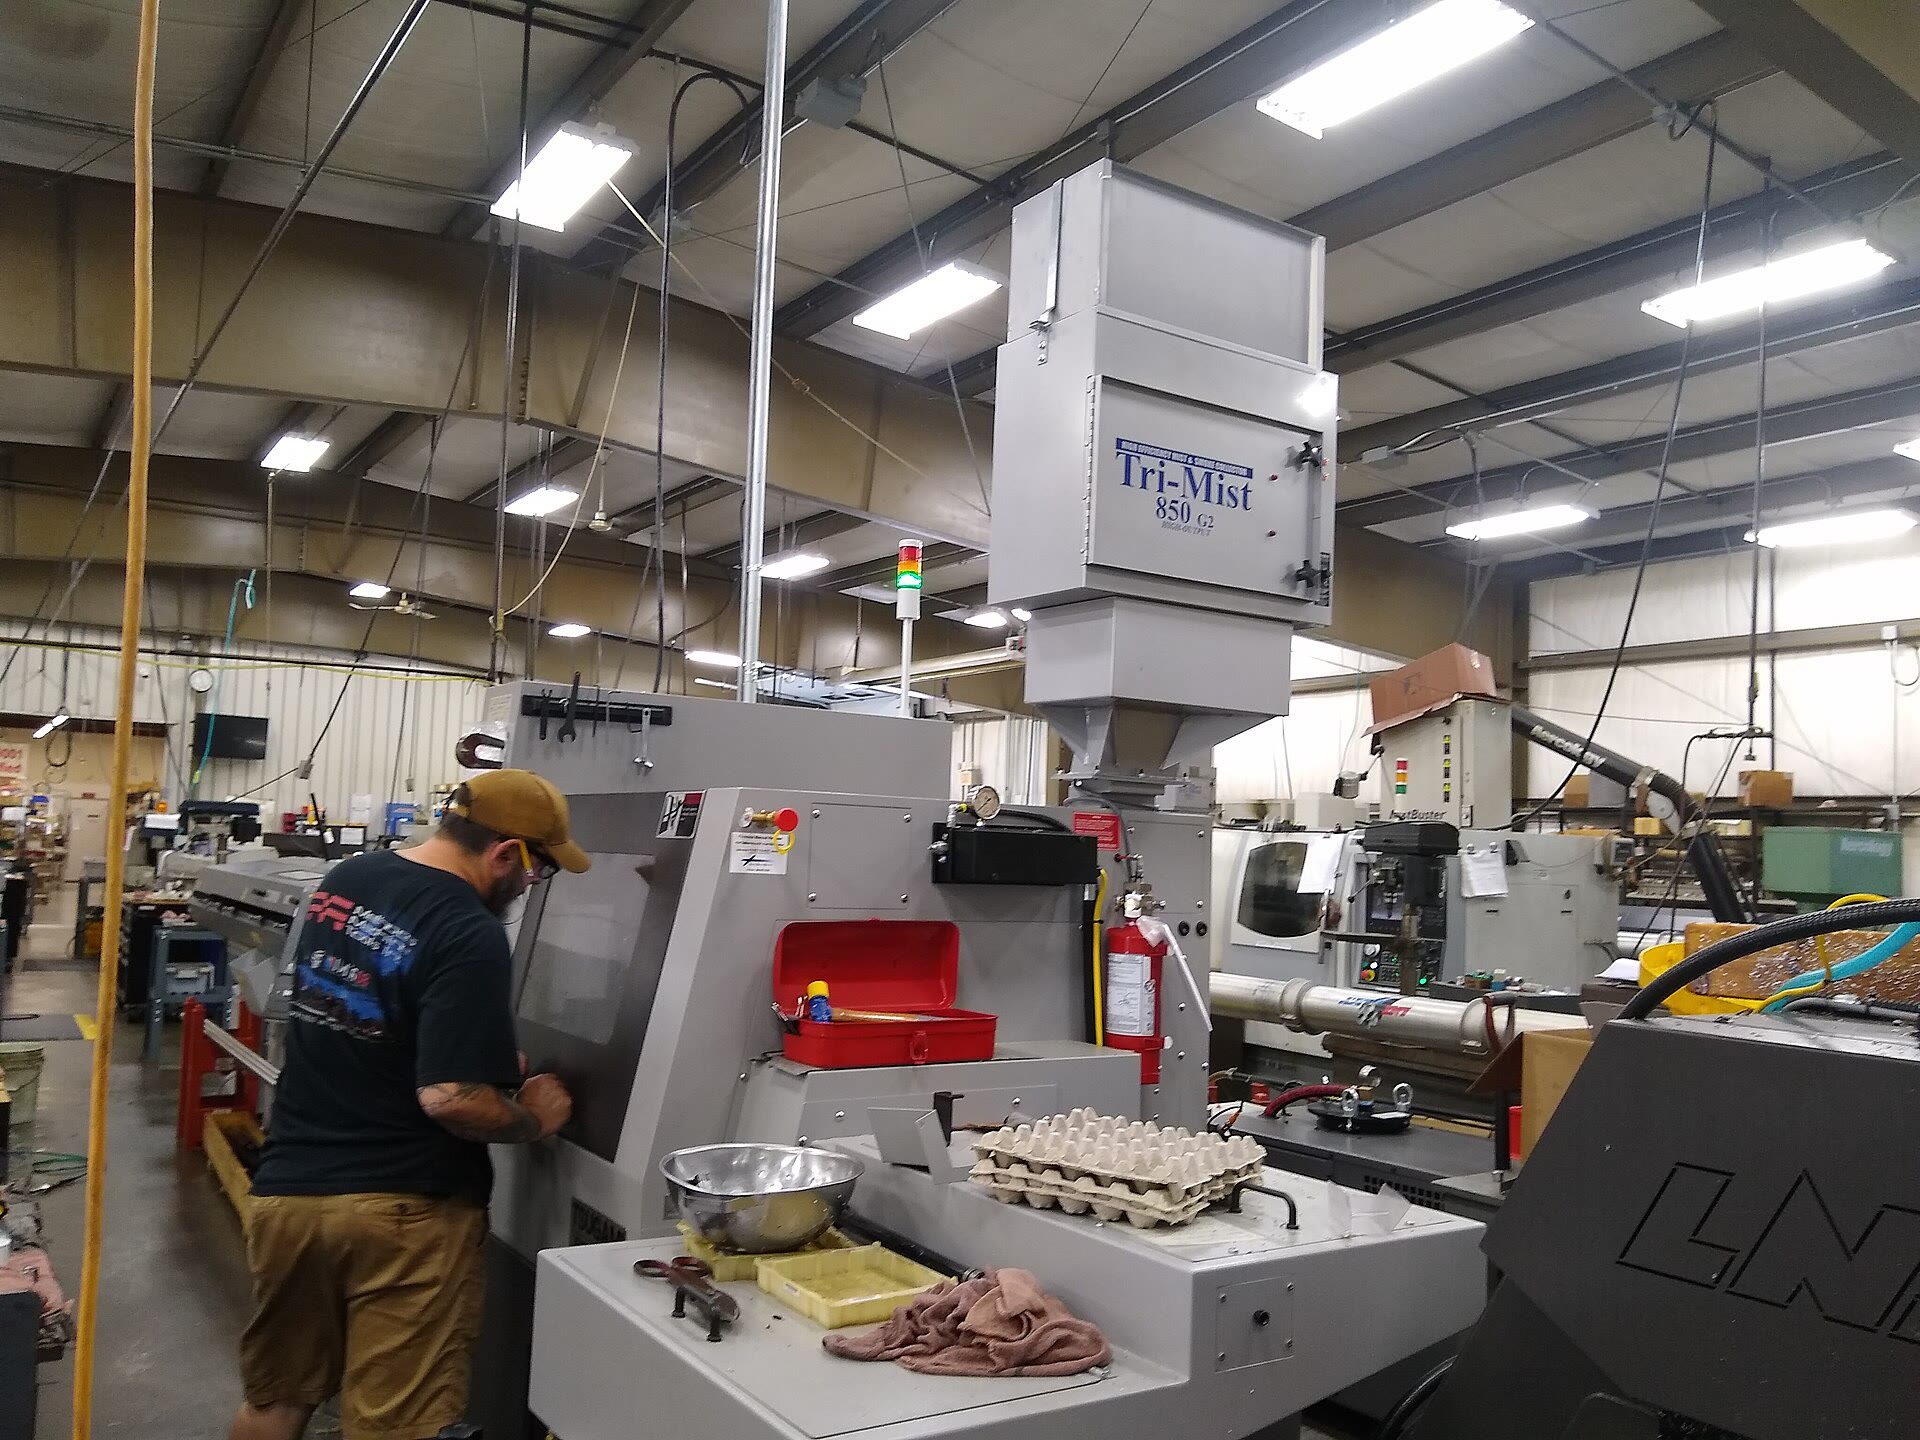
Auto components
Which machine really caps output.
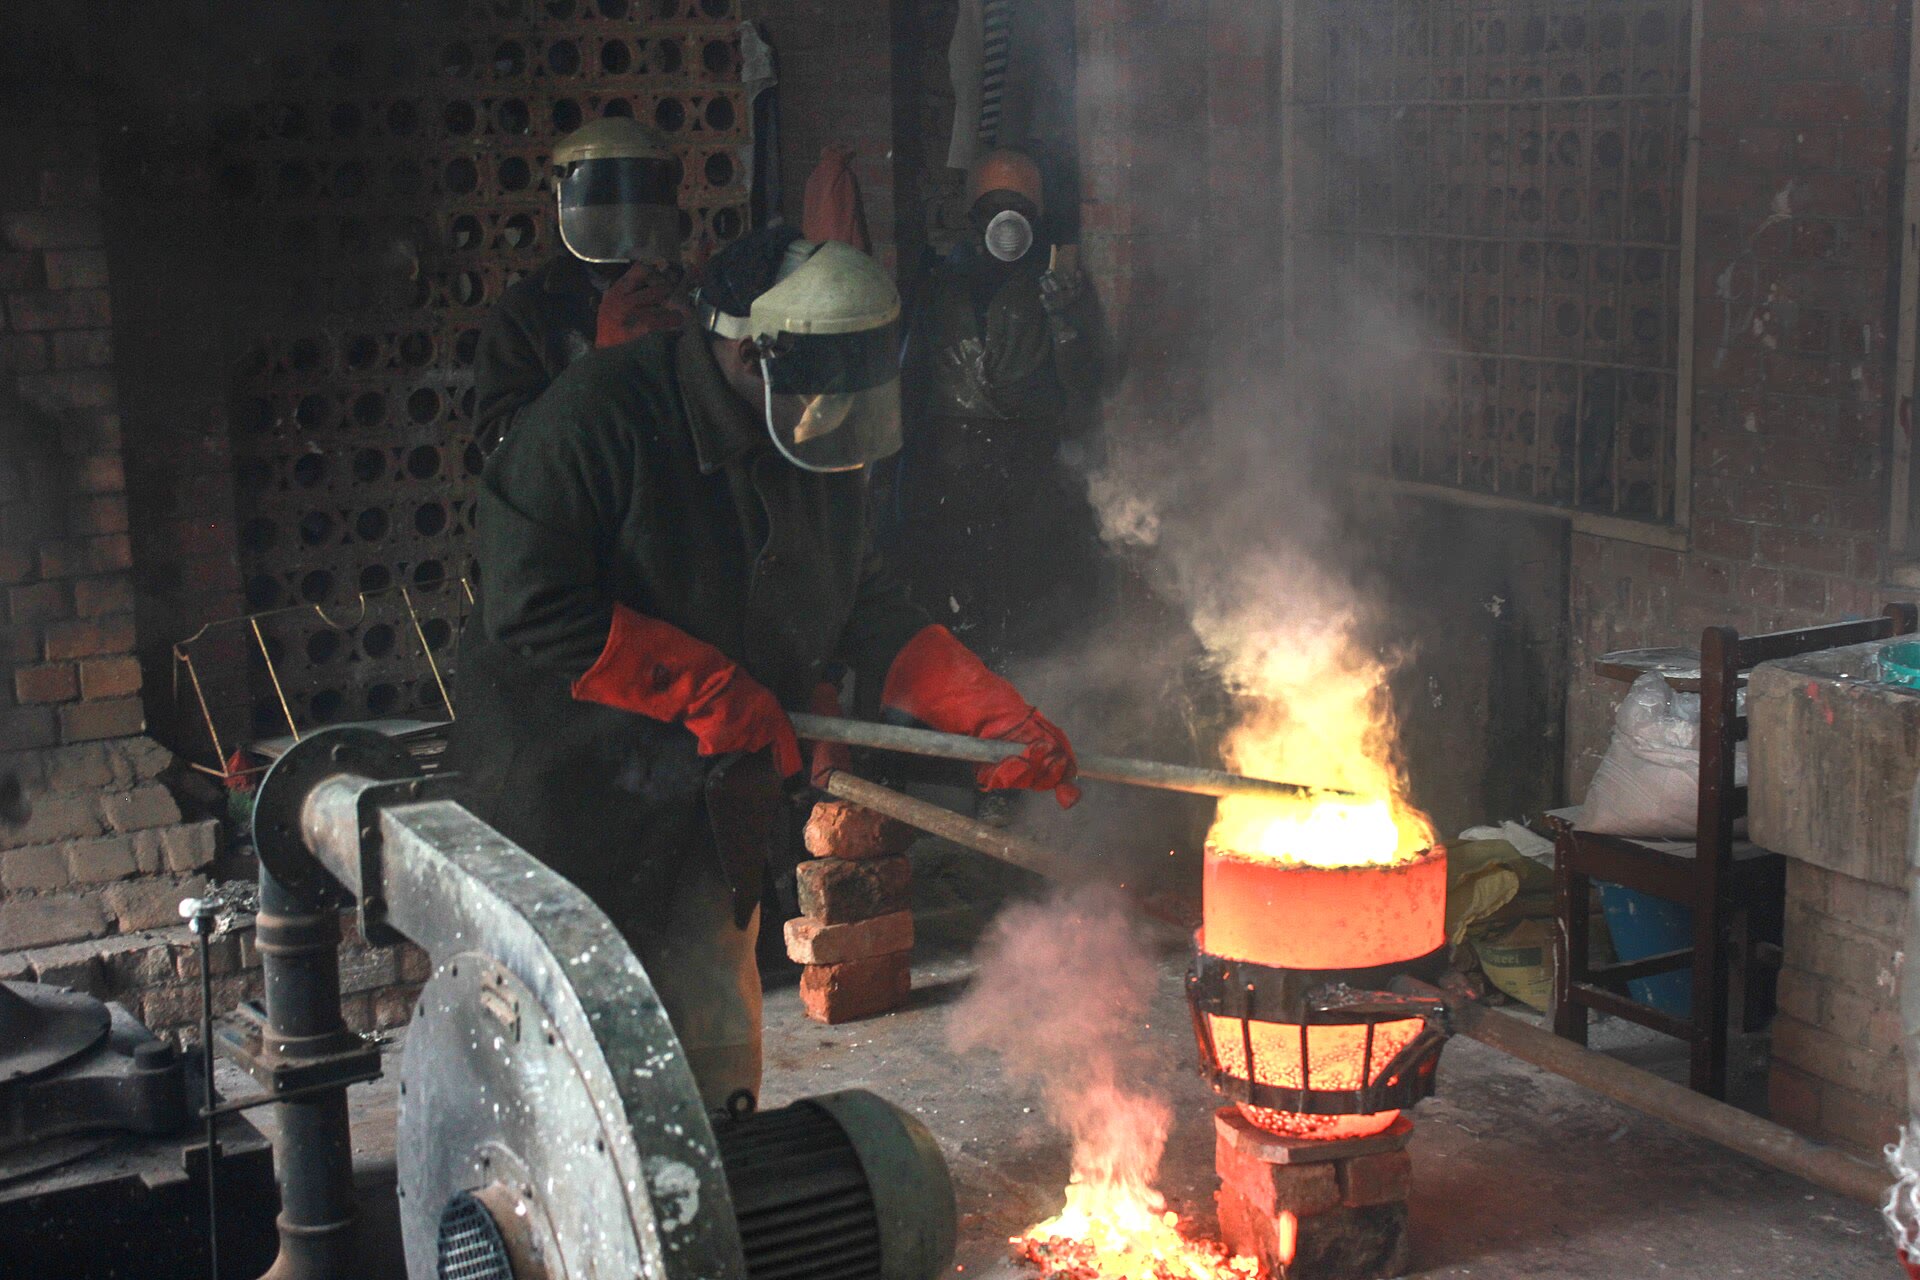
Foundries
What a rejected casting really costs.
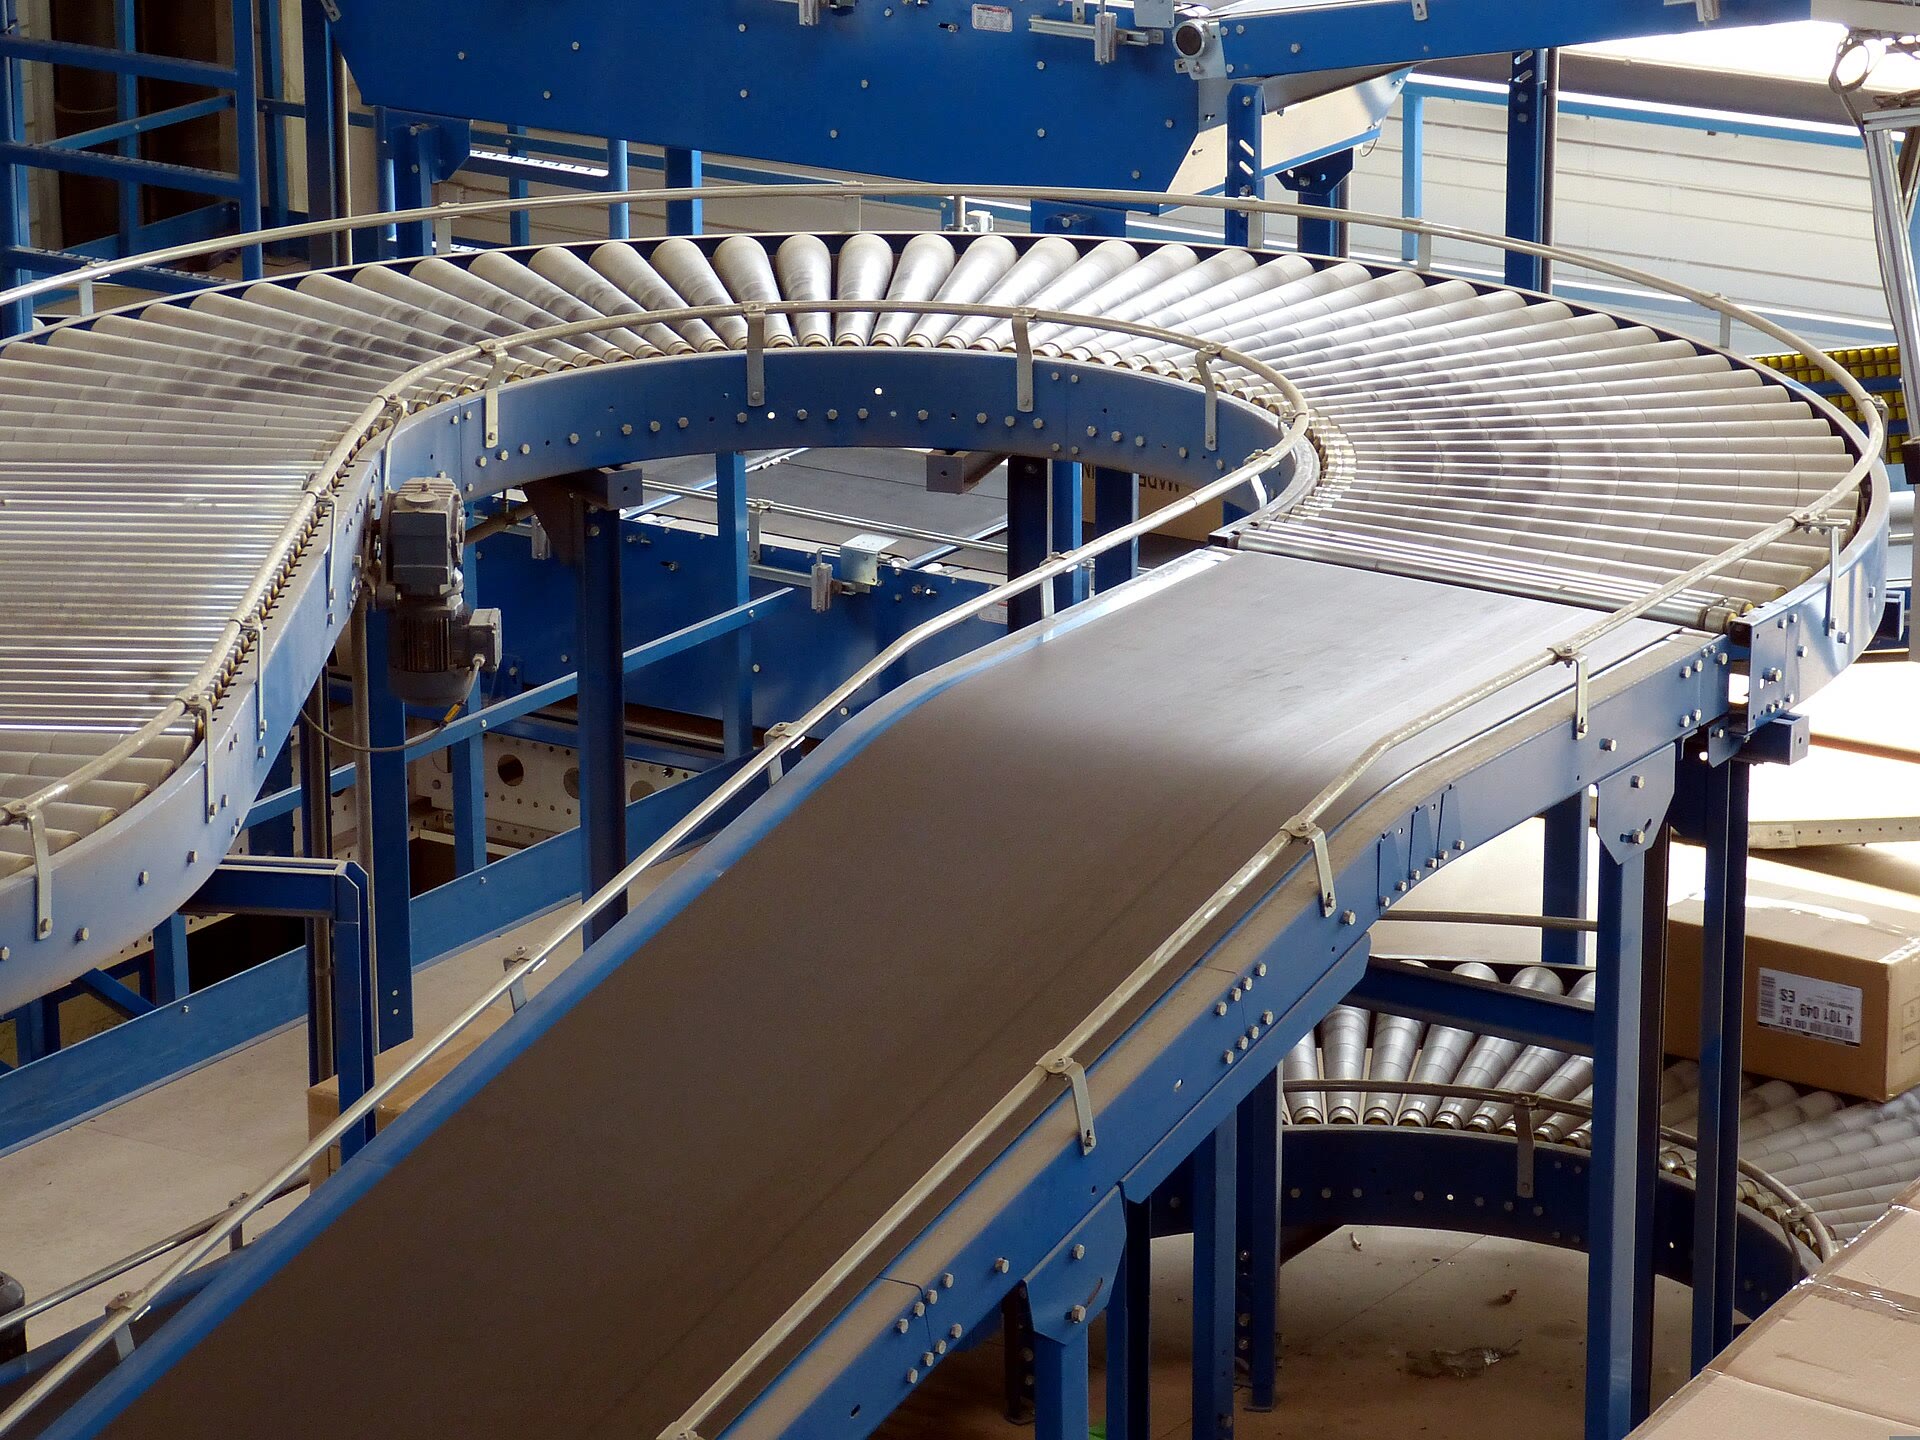
Packaging and bottling
What actually stops the line.
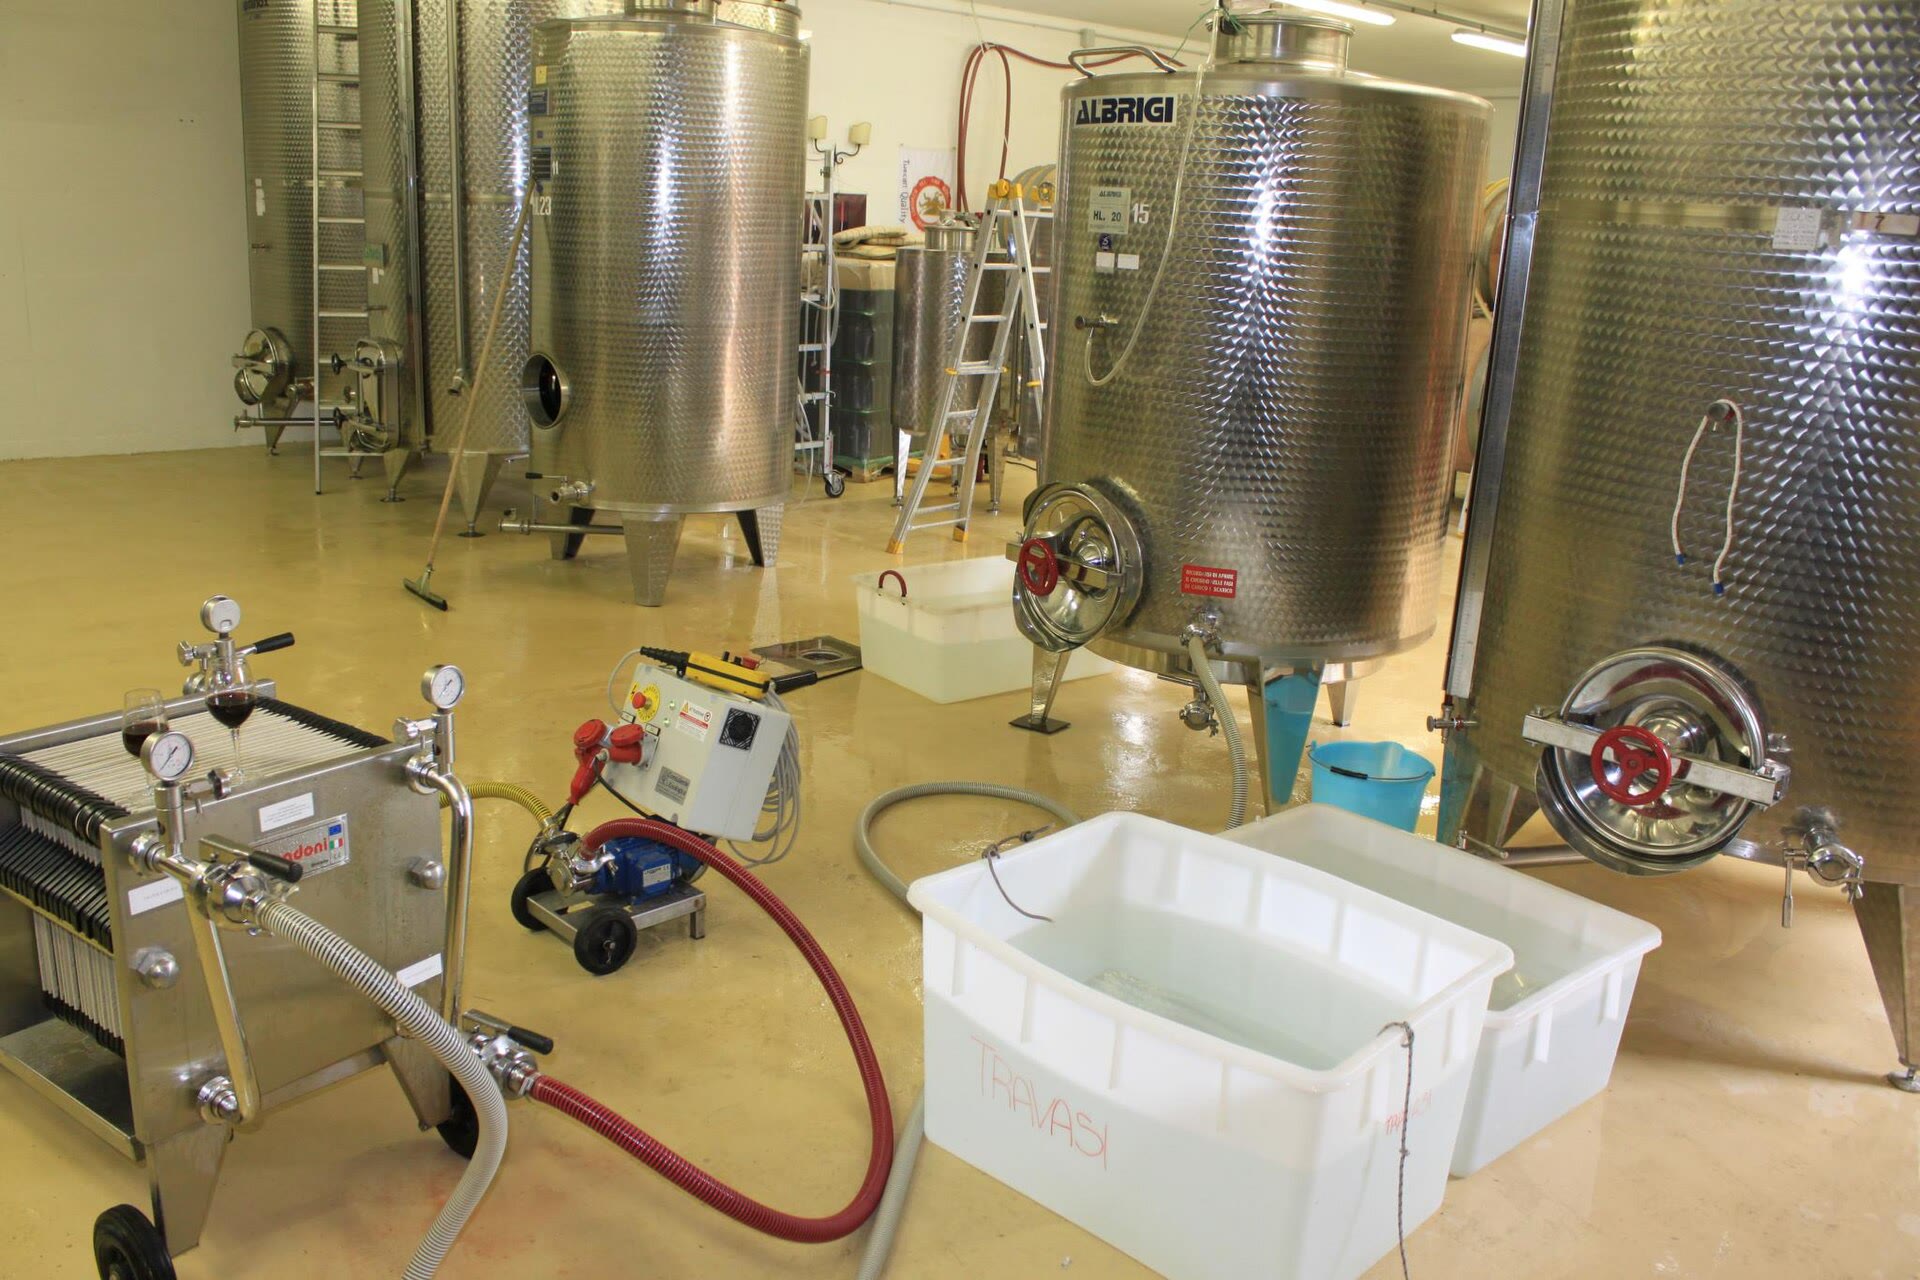
Process and chemicals
Where the batch hours go.
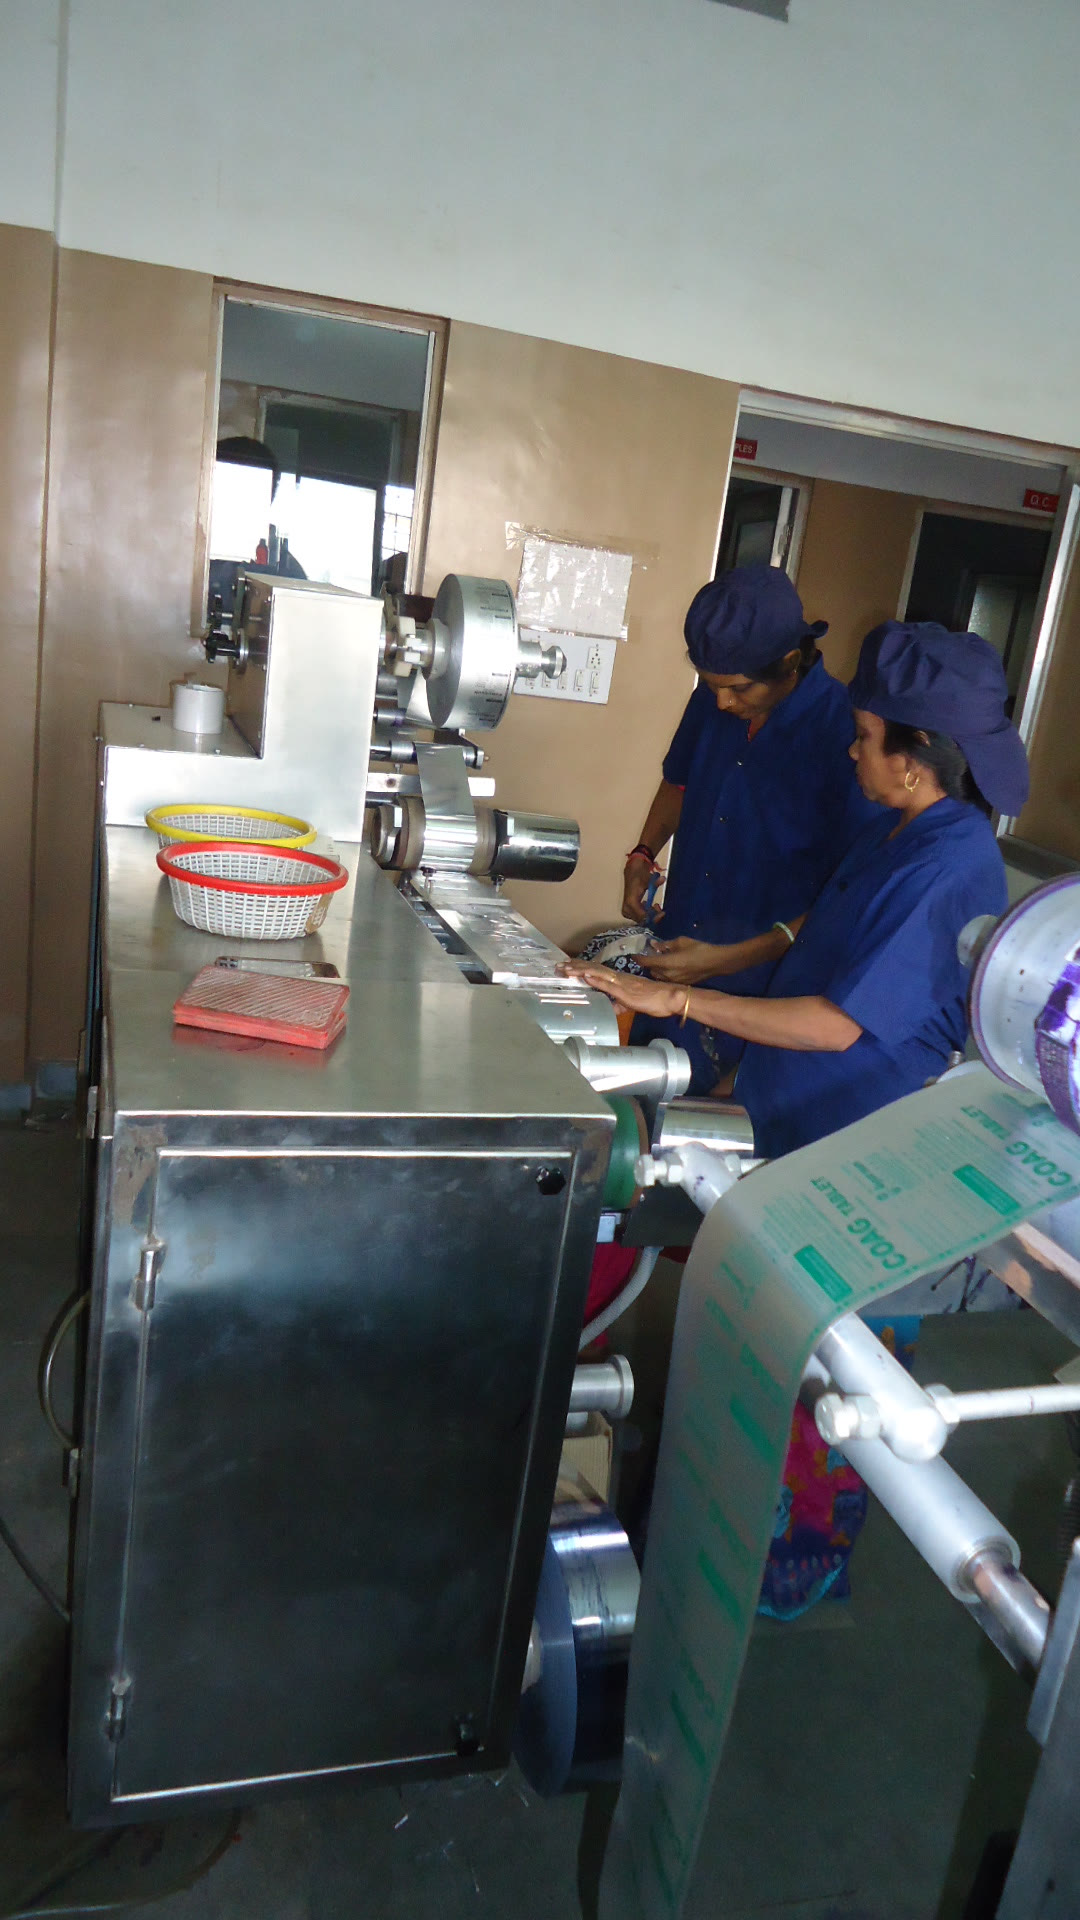
Pharma formulations
Changeover and cleaning, per batch.
Photos are stock images, not client plants.
Via Wikimedia Commons: CNC lathe by Whoisjohngalt (CC BY-SA 4.0), casting by Samson iron (CC BY-SA 4.0), conveyor by falco (CC0), fermenters by Drew Cuddy (CC BY-SA 2.0), blister line by Aditiaudi (CC BY-SA 4.0), milling footage by Amada44 (CC BY 3.0).
Who reads your records
A small engineering practice. No account managers, no juniors.

Sagar Parmar
Founder
The founder reads your records and answers your emails. His father spent his working life in Indian manufacturing, so shift sheets and downtime registers are not new to him.
- Five-plus years building machine-learning and video systems at Samsung R&D and IBM.
- Two computer-vision patents filed at Samsung. Reading a photographed shift sheet is the same kind of problem.
- Two peer-reviewed papers on applied deep learning, 2025.
- B.Tech in Electronics and Communication Engineering, SVNIT Surat.
How we work
- Fixed fee, in writing, before Monday.
- We never connect to your systems. We work from copies, and delete them when you ask.
- You keep everything: the report, the reconciled data, the file, the code.
- No predictions without history. We measure first, and build models only where the records justify them.
Start here
Book a 20-minute call. Nothing to send.
Tell us what you make and when suits. We reply within two working days, and will say so if a week wouldn't be worth it.
Free
A 20-minute call.
What you make, what you already record. We tell you which question to answer first, and whether a week is worth it.
Fixed fee
The week, remote.
Records change hands only after the call: one month, copies only, deleted when you ask.
Fixed fee
The follow-on, 6 to 8 weeks.
Quoted at the end of the week. Dashboards, data extraction or predictive maintenance, whichever the week showed is worth doing.
Optional
Five days on site.
Only if the records are incomplete. Read-only, instrumented, priced before anyone travels.