For manufacturing plants
More output from the same plant.
We turn noisy shop-floor records into focused decisions, so the line stops less, runs closer to its best, and makes more money. Less time chasing scattered numbers. Clearer calls on what to fix.
- Less Downtime
- Golden Batch Consistency
- Noise-Free Data
- Focused Action
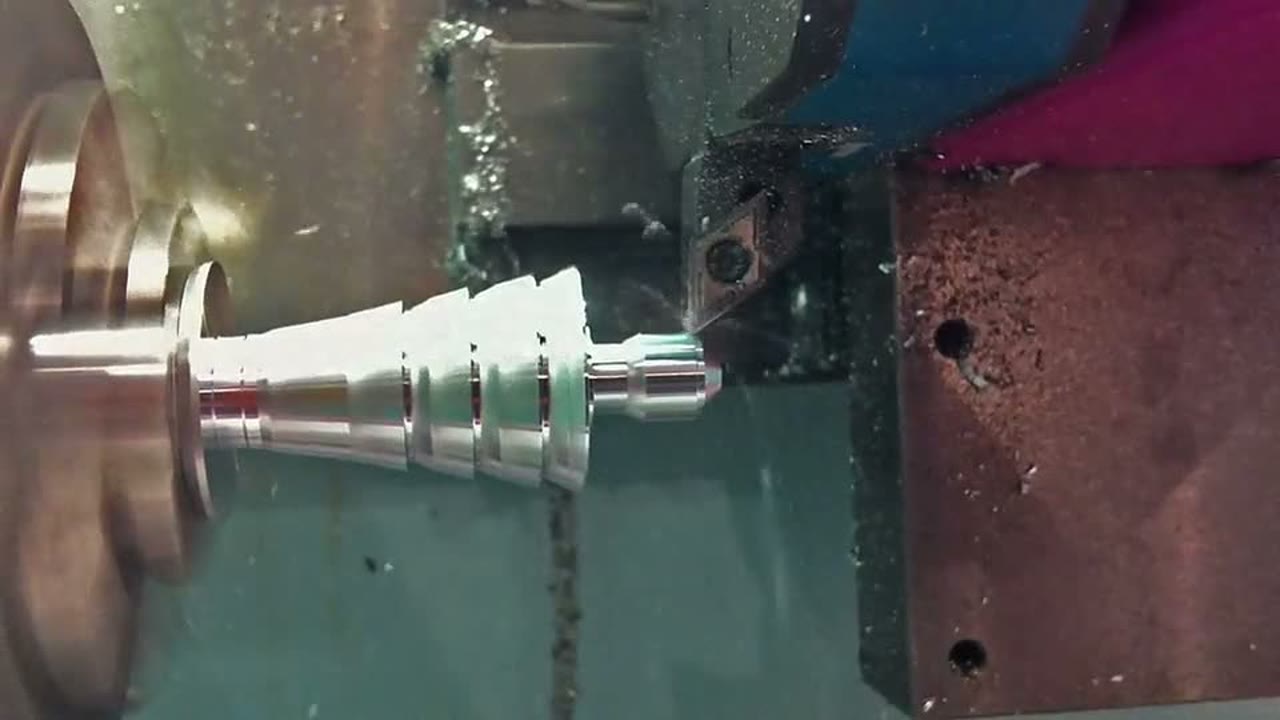
Turning a steel bar.
Where we start
First, we measure. Then, we build.
We never start by installing new software, ripping out your current systems, or attaching sensors to your machines.
First, we do a 5-day, read-only audit. We take one month of the records you already keep, reconcile the gaps, and map your true bottlenecks. You get a clear, ranked roadmap of what to fix first.
Then, once we know exactly what needs fixing, we deploy the long-term solutions below.
See how the 5-day week worksThe week
Five days.
Example plant. Made-up numbers, real method.
Downtime log · sample
+ 210 more rows
28 hrs/mo
Lost on Op 30.
Every stop, by machine
214 stops in one month. 28 hours of them on one machine, Op 30.
Downtime log · sample
DateSh.OpReasonMin03 MarAOp 30tool change4005 MarBOp 50waiting material6514 MarAOp 30setup8027 MarCOp 30setup120+ 210 more rows
28 hrs/mo
Lost on Op 30.
Three records, three totals
Same month, three different unit counts. And 69 hours no one wrote down.
Reconciliation · one month
Units · shift sheets12,840Units · despatch book12,310Units · ERP postings12,955Op 30 hours · planned 528, running 431, stops 28runningrecorded stopsunexplained69 hrs
Hours no one wrote down. Often the biggest number.
The machine that limits output
Everyone blamed Op 50 because it had the queue. Op 30 was at 94% load.
Load by operation · % of available hours
Op 10
SawOp 20
TurnOp 30
MillOp 40
DrillOp 50
GrindOp 60
WashOp 30, in orange, limits output.
One shift, one view
Losses, rejects, queue and setups, against your own targets.
This shift, at a glance
6.5 hrs
Lost on Op 30 this week (flagged)
2.8%
Rejects this week
41 hrs
Queued in front of Op 30 (flagged)
9
Setups on Op 30 (own target: 6) (flagged)
38%
Of lost hours were tool changes (flagged)
87%
Despatched on the day
One file. Opens in any browser. Yours to keep.
- Monday
You send records.
One month, photos or exports. Nothing is kept or retained.
- Tuesday
We match them.
Every gap in units and hours, listed.
- Wed to Thu
We find the limit.
Each machine loaded with your real product mix.
- Friday
You get the answer.
What to fix first, and what it's worth.
Opt-in, not lock-in
The Opt-In. You decide if we build the rest.
Most tech vendors and large consultancies lock you into a 6-month discovery phase. They charge massive upfront fees, take months to deliver, and hand you a generic AI dashboard built by a junior team that has never set foot on a shop floor.
We do the exact opposite. We deliver a complete, actionable audit in one week. Once you see the data, you decide if you want to proceed with the automated pipelines and predictive models.
| The Big Tech Way | The CodeWaves Way |
|---|---|
| 6-Month DiscoveryMonths of meetings before you see a single result. | 5-Day ResultsA complete, ranked roadmap in one week. |
| Generic AIOff-the-shelf dashboards that ignore your specific machines. | Custom EngineeringBuilt specifically on your actual shift sheets and logs. |
| Zero AttentionYou get a junior project manager; the senior engineers are on other accounts. | Direct AccessYou talk to the senior engineer, with patents and papers, who actually writes the code. |
| Mandatory Lock-inYou pay for the whole year before knowing if it works. | The Opt-InYou review the 1-week audit first. Then you decide if we build the rest. |
If the 1-week audit gives you everything you need to fix the plant yourself, you keep the file and we walk away. If you want us to automate the data and predict the downtime, we build it.
Solutions
What we actually deliver.
Industry experts and an engineering team that ship production-grade systems for commercial use, then stay to make them better.
Noise-Free Data & Automated Reconciliation
We stop the manual spreadsheet hunting. We build automated pipelines that pull from your existing shift sheets, downtime logs and ERP exports, giving you a single, clean source of truth in your own systems, without forcing your team to learn new software.
Predictive Downtime Reduction
Stop reactive fire-fighting. By applying proven machine learning to your historical maintenance and stoppage records, we flag exactly which machines are likely to fail next, so you can schedule maintenance before it costs you a shift.
Yield Optimization & Golden Batch Tracking
Same plant, higher output. We map your real product mix against actual machine loads to find the true bottleneck, then help you identify and replicate the exact conditions of your highest-yield runs.
A Ranked, Actionable Roadmap
You don't get a vague, flashy AI dashboard. You get a prioritized list of exactly what to fix first, precisely what each fix is worth in recovered hours and units, and the lightweight tools to keep tracking it.

Less Downtime
Shift from reactive fire-fighting to predictable, planned operations.

Golden Batch Consistency
Identify and replicate the exact conditions of your highest-yield runs.

Noise-Free Data
Clear, automated insights that replace endless manual spreadsheet hunting.
Focused Action
A ranked list of exactly what to fix first, measured in recovered hours and units.
Who we are
You talk to the engineer who does the work.

Sagar Parmar
Founder
Previously at
- Amazon
- IBM
- Samsung R&D
- Computer vision expert and cloud deployment engineer.
- Patents filed in computer vision, and peer-reviewed research in deep learning.
- Grew up in industry: his father spent his working life on Indian manufacturing shop floors.
Our promise
Results, or your money back.
If any project we deliver doesn't produce results worth what you paid, we refund you in full.